
Smart advertisers use promotional products statistics to guide their branding efforts.
Successful marketing teams tap the most recent research and data to find out what engages and motivates consumers.
To save you time, I’ve gathered the most recent and vital promotional products statistics available. Take a look to get the biggest ROI for your advertising dollars.
Promotional products statistics
- Promotional products are the favorite form of advertising for U.S. consumers of all ages.
- Most households own an average of 30 promotional products.
- 53% of people use a promotional product at least once each week.
- 81% of the population keeps customized promotional products more than a year.
- 40% of consumers keep some promotional items more than 10 years.
- Promotional products are the most highly regarded form of advertising over newspapers, radio, magazines, television, the Internet and mobile ads.
- More than half of consumers wish they could receive promotional products more often.
- 89% of consumers have received a promotional product in the last six months.
- The top 10 buyers of promotional products are business services, education, financial, manufacturing, healthcare, construction, insurance, technology, nonprofits and agriculture.
- 96% of consumers want to know ahead of time if a company is offering promotional products.
- 59% say if money was tight, they’d rather receive a useful promo item than be exposed to an advertisement.
- 59% of people say quality is more important than quantity when it comes to promotional products.
- Nearly one-quarter (23%) of consumers purchased a promotional product in the last year.
- 63% of consumers pass along a promotional product they no longer want.
The impact of promotional products
- 73% of people are more likely to do business with a brand that gave them a promotional product.
- 83% of people would experience a strengthened loyalty to a brand they currently shop with that gave them a promotional product.
- Nine in 10 people recall the company’s name or logo on the promotional item they received.
- 61% of consumers would research a brand that gave them a customized promotional item.
- 72% of people associate the quality of a customized promotional product with the reputation of the company.
- 46% of the population has a more favorable opinion of an advertiser who gave them an environmentally friendly promo item.
- 52% of consumers have a higher opinion of an advertiser who gives them a promotional product made in the U.S.A.
- 52% of trade show visitors are more likely to visit an exhibit with giveaway items.
- 62% of workers feel appreciated by their employer when they are given promotional products as a gift.
- 52% of employees feel included as part of a team when receiving promo items from an employer.
Specific promotional products data
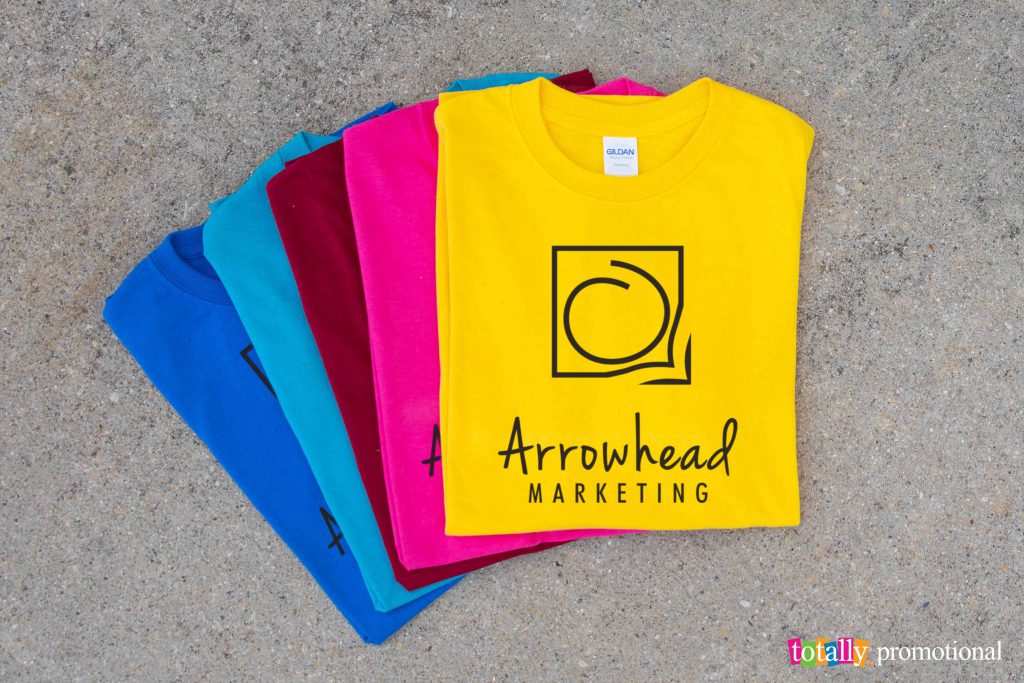
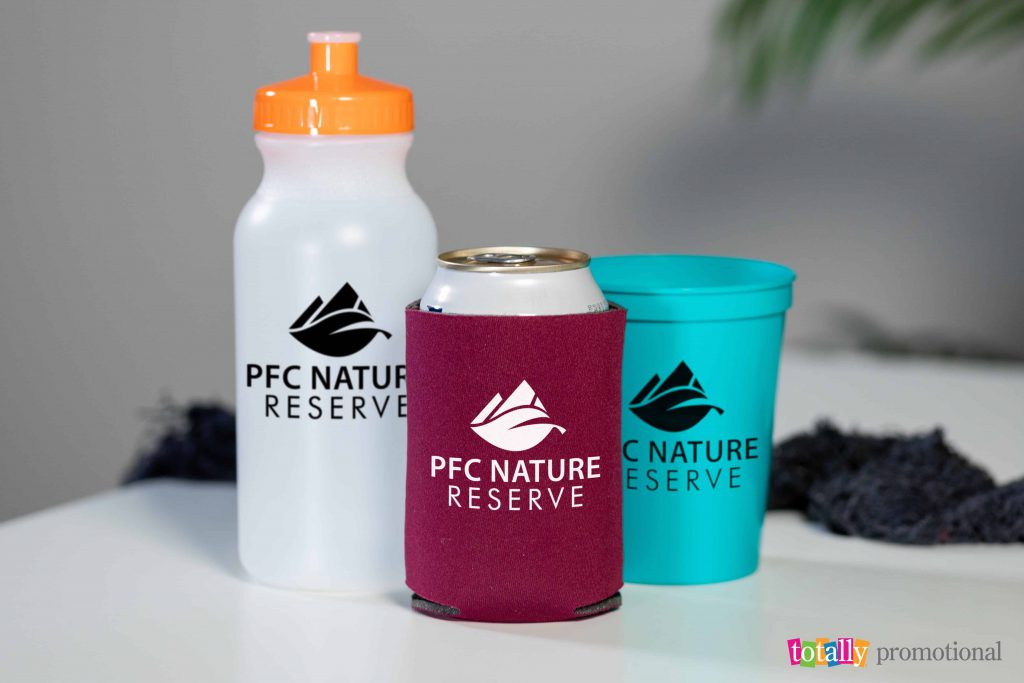
- The most popular promotional products today are apparel (28%) drinkware (8.4%), writing utensils (6.6%), bags and wallets (6.3%) and technology (5.6%).
- The most influential promo items among men are: outerwear, performance wear, polo shirts, writing instruments and umbrellas with logos.
- The most influential promo items among women are: outerwear, health and safety, performance wear, bags and drinkware.
- Promotional drinkware such as custom cups and branded can coolers generate 3,162 impressions throughout their lifetime.
- 90% of consumers own more than one branded drinkware item.
- 47% of people keep custom T-shirts for two or more years because of their attractiveness.
- Performance wear generates 2,336 impressions over its lifetime.
- 69% of consumers own promotional hats and other types of headwear.
- 89% of the population owns a logoed pen, pencil or another type of writing instrument.
- 73% of consumers own custom bags.
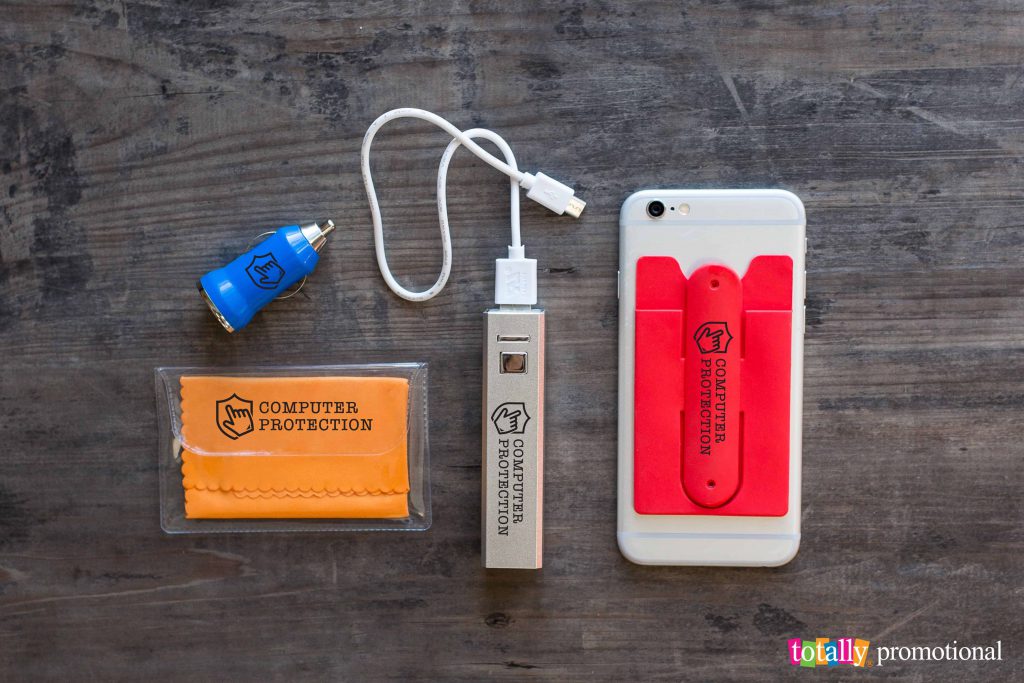
- 40% of consumers who receive a logo power bank/charger are more likely to do business with the advertiser who gave it to them.
- Customized umbrellas generate 1,760 impressions over their lifetime.
- 43% of consumers would keep and use a promotional bag for two years or longer.
- 64% of consumers own customized desk or office accessories.
- Customized USBs on average are kept 13 months.
- 45% of consumers own personalized umbrellas.
- Outerwear/fleece apparel generates 7,856 impressions over its lifetime.
- 33% of consumers own customized power banks.
- A branded metal pen that costs $1 will have a CPI of less than 1/10 of a cent.
- Custom polo shirts will generate 2,106 impressions over their lifetime.
Don’t ignore proven success
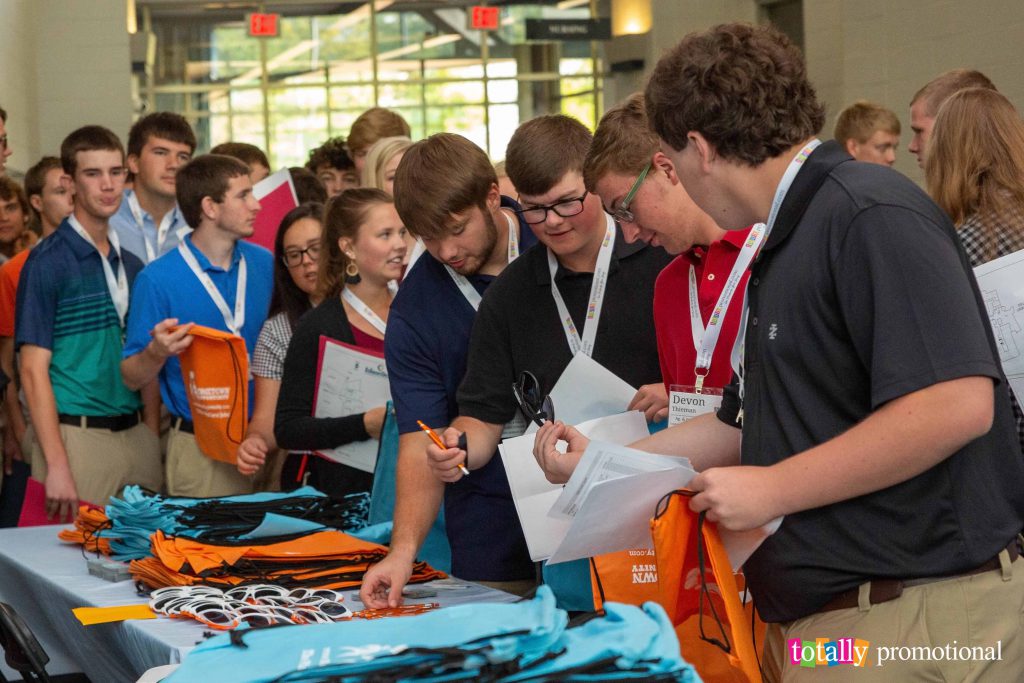
Nothing draws attention like a free gift. Every business or organization benefits by handing out promotional products at trade shows and community events. It’s an extremely affordable way to keep your name in front of your target audience.
Put promotional products to work for you!
— Statistics from The Advertising Specialty Institute and Promotional Products Association International